Editable world maps for your PowerPoint presentations. Maps by continent, editable by country, ready to use. 100% free.
What's in the download
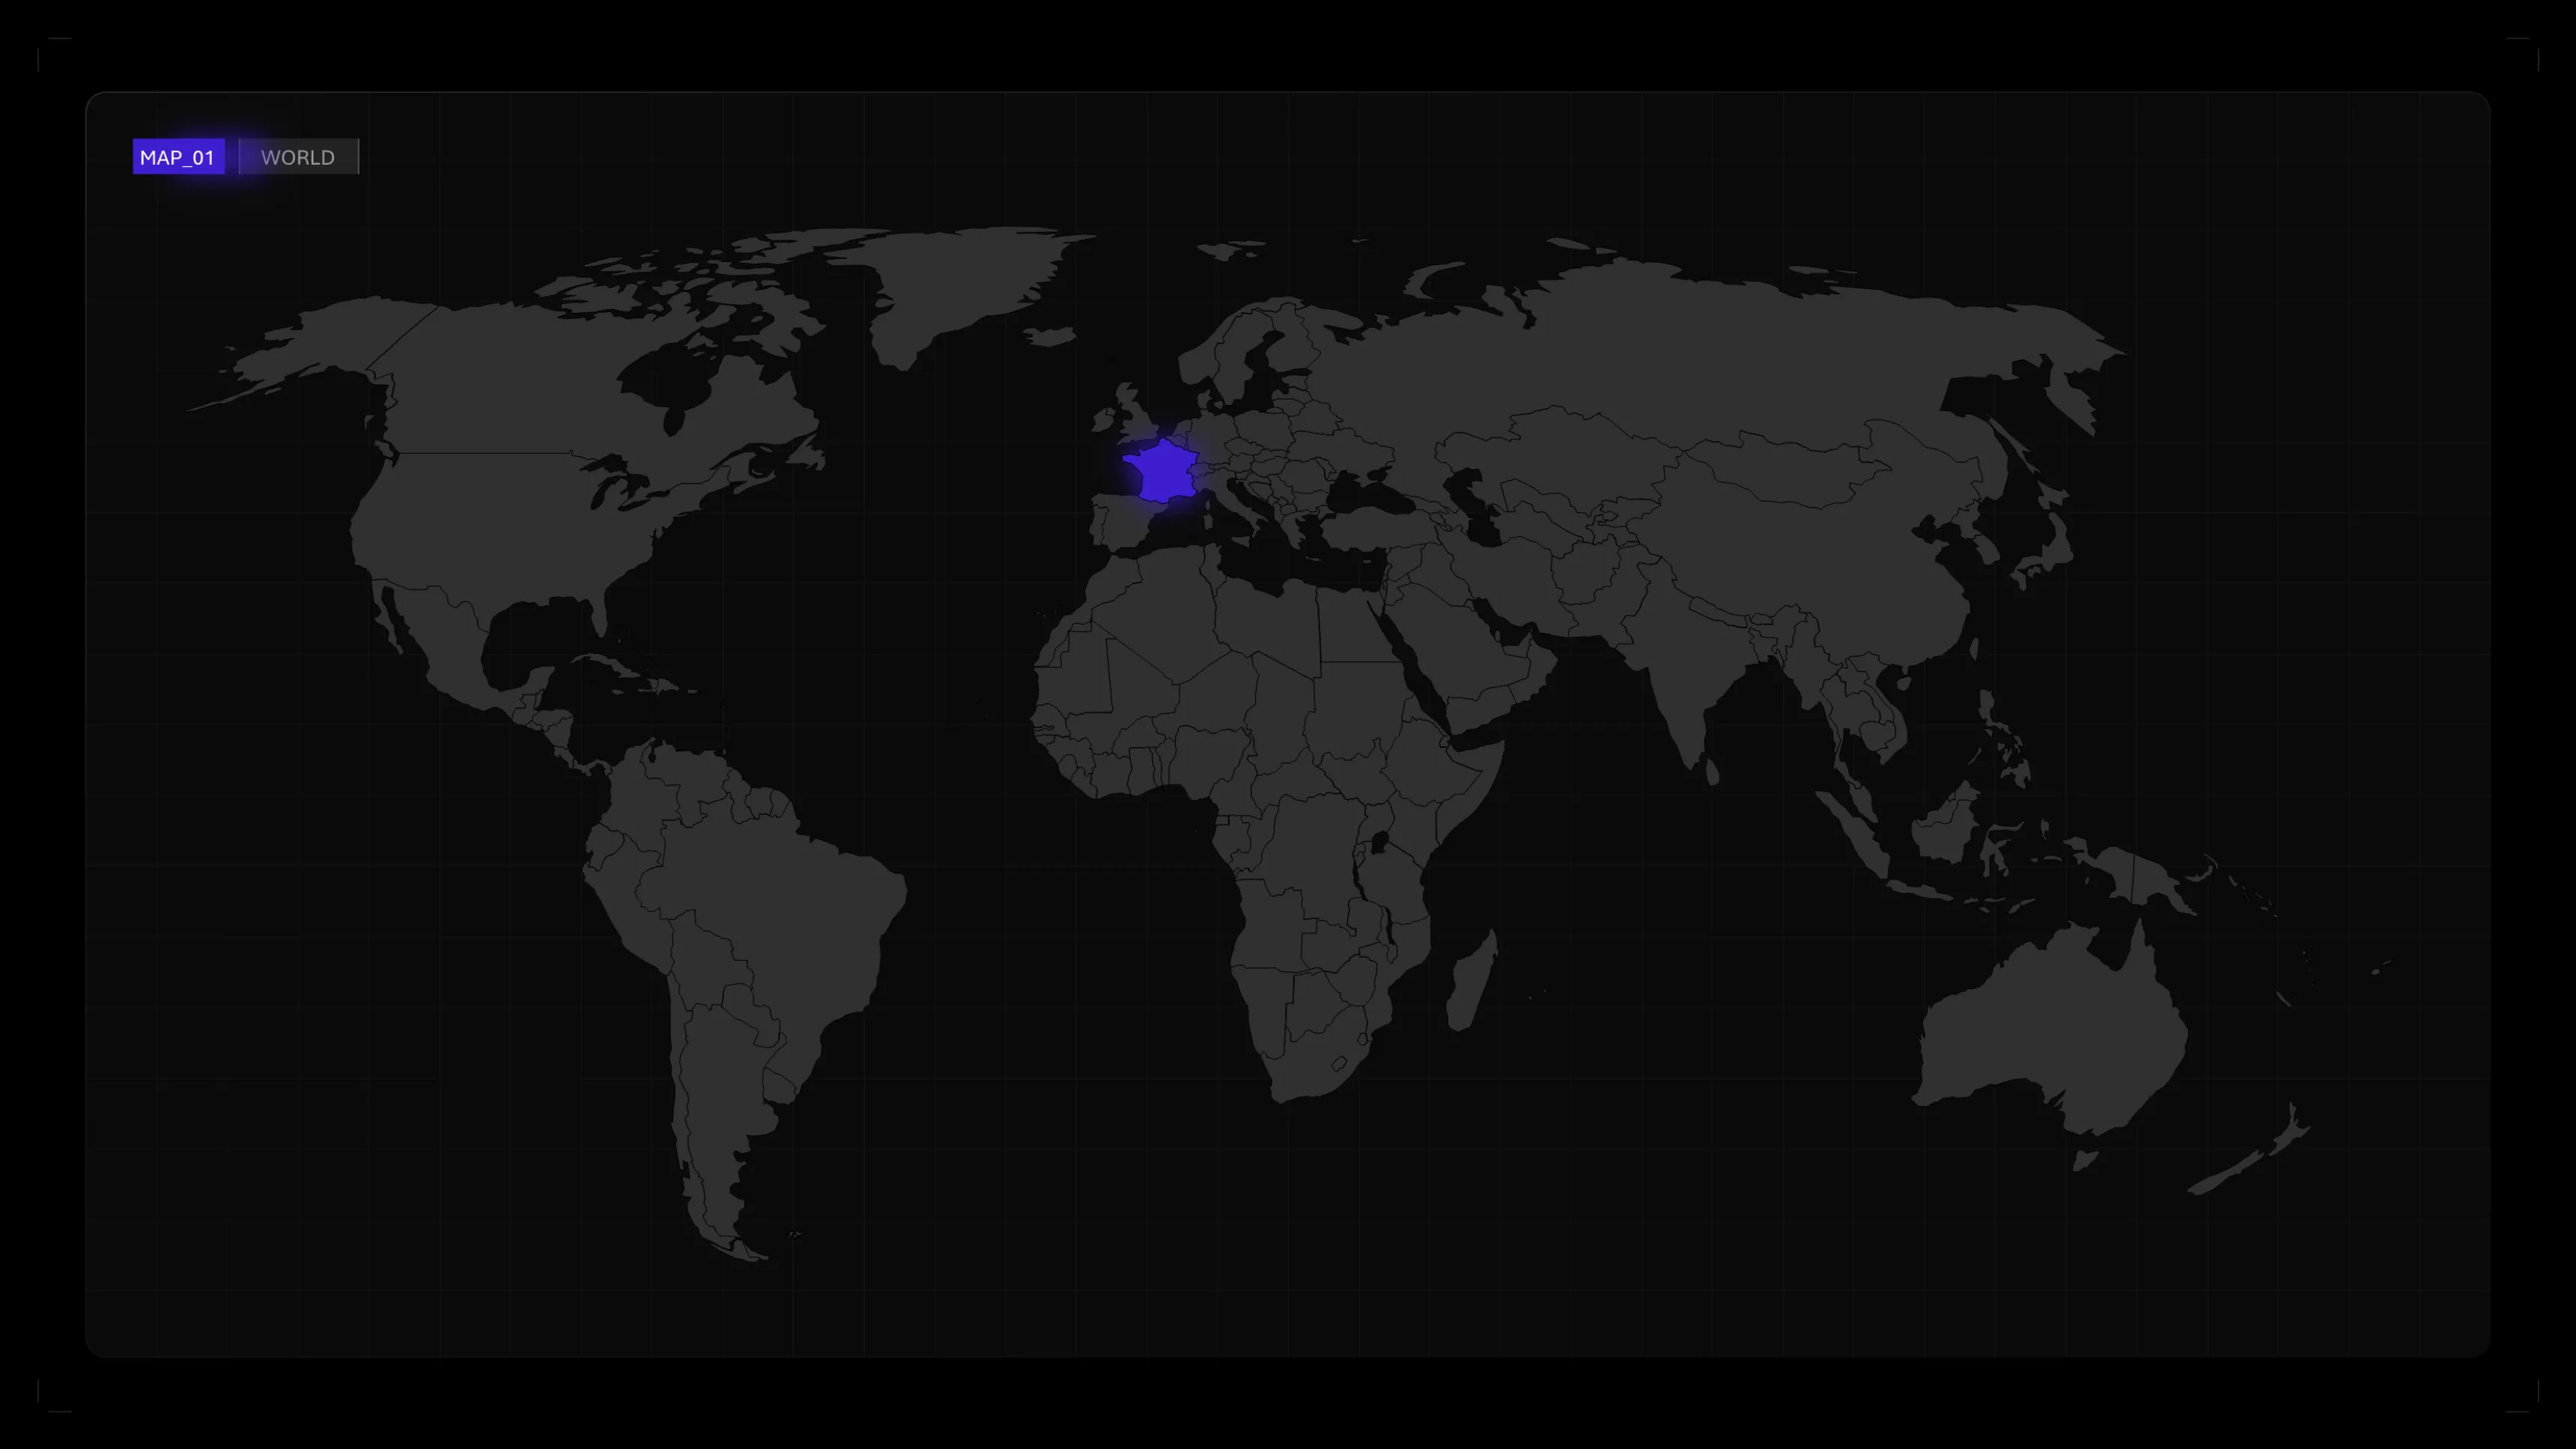
- Full world map with all countries, editable in PowerPoint
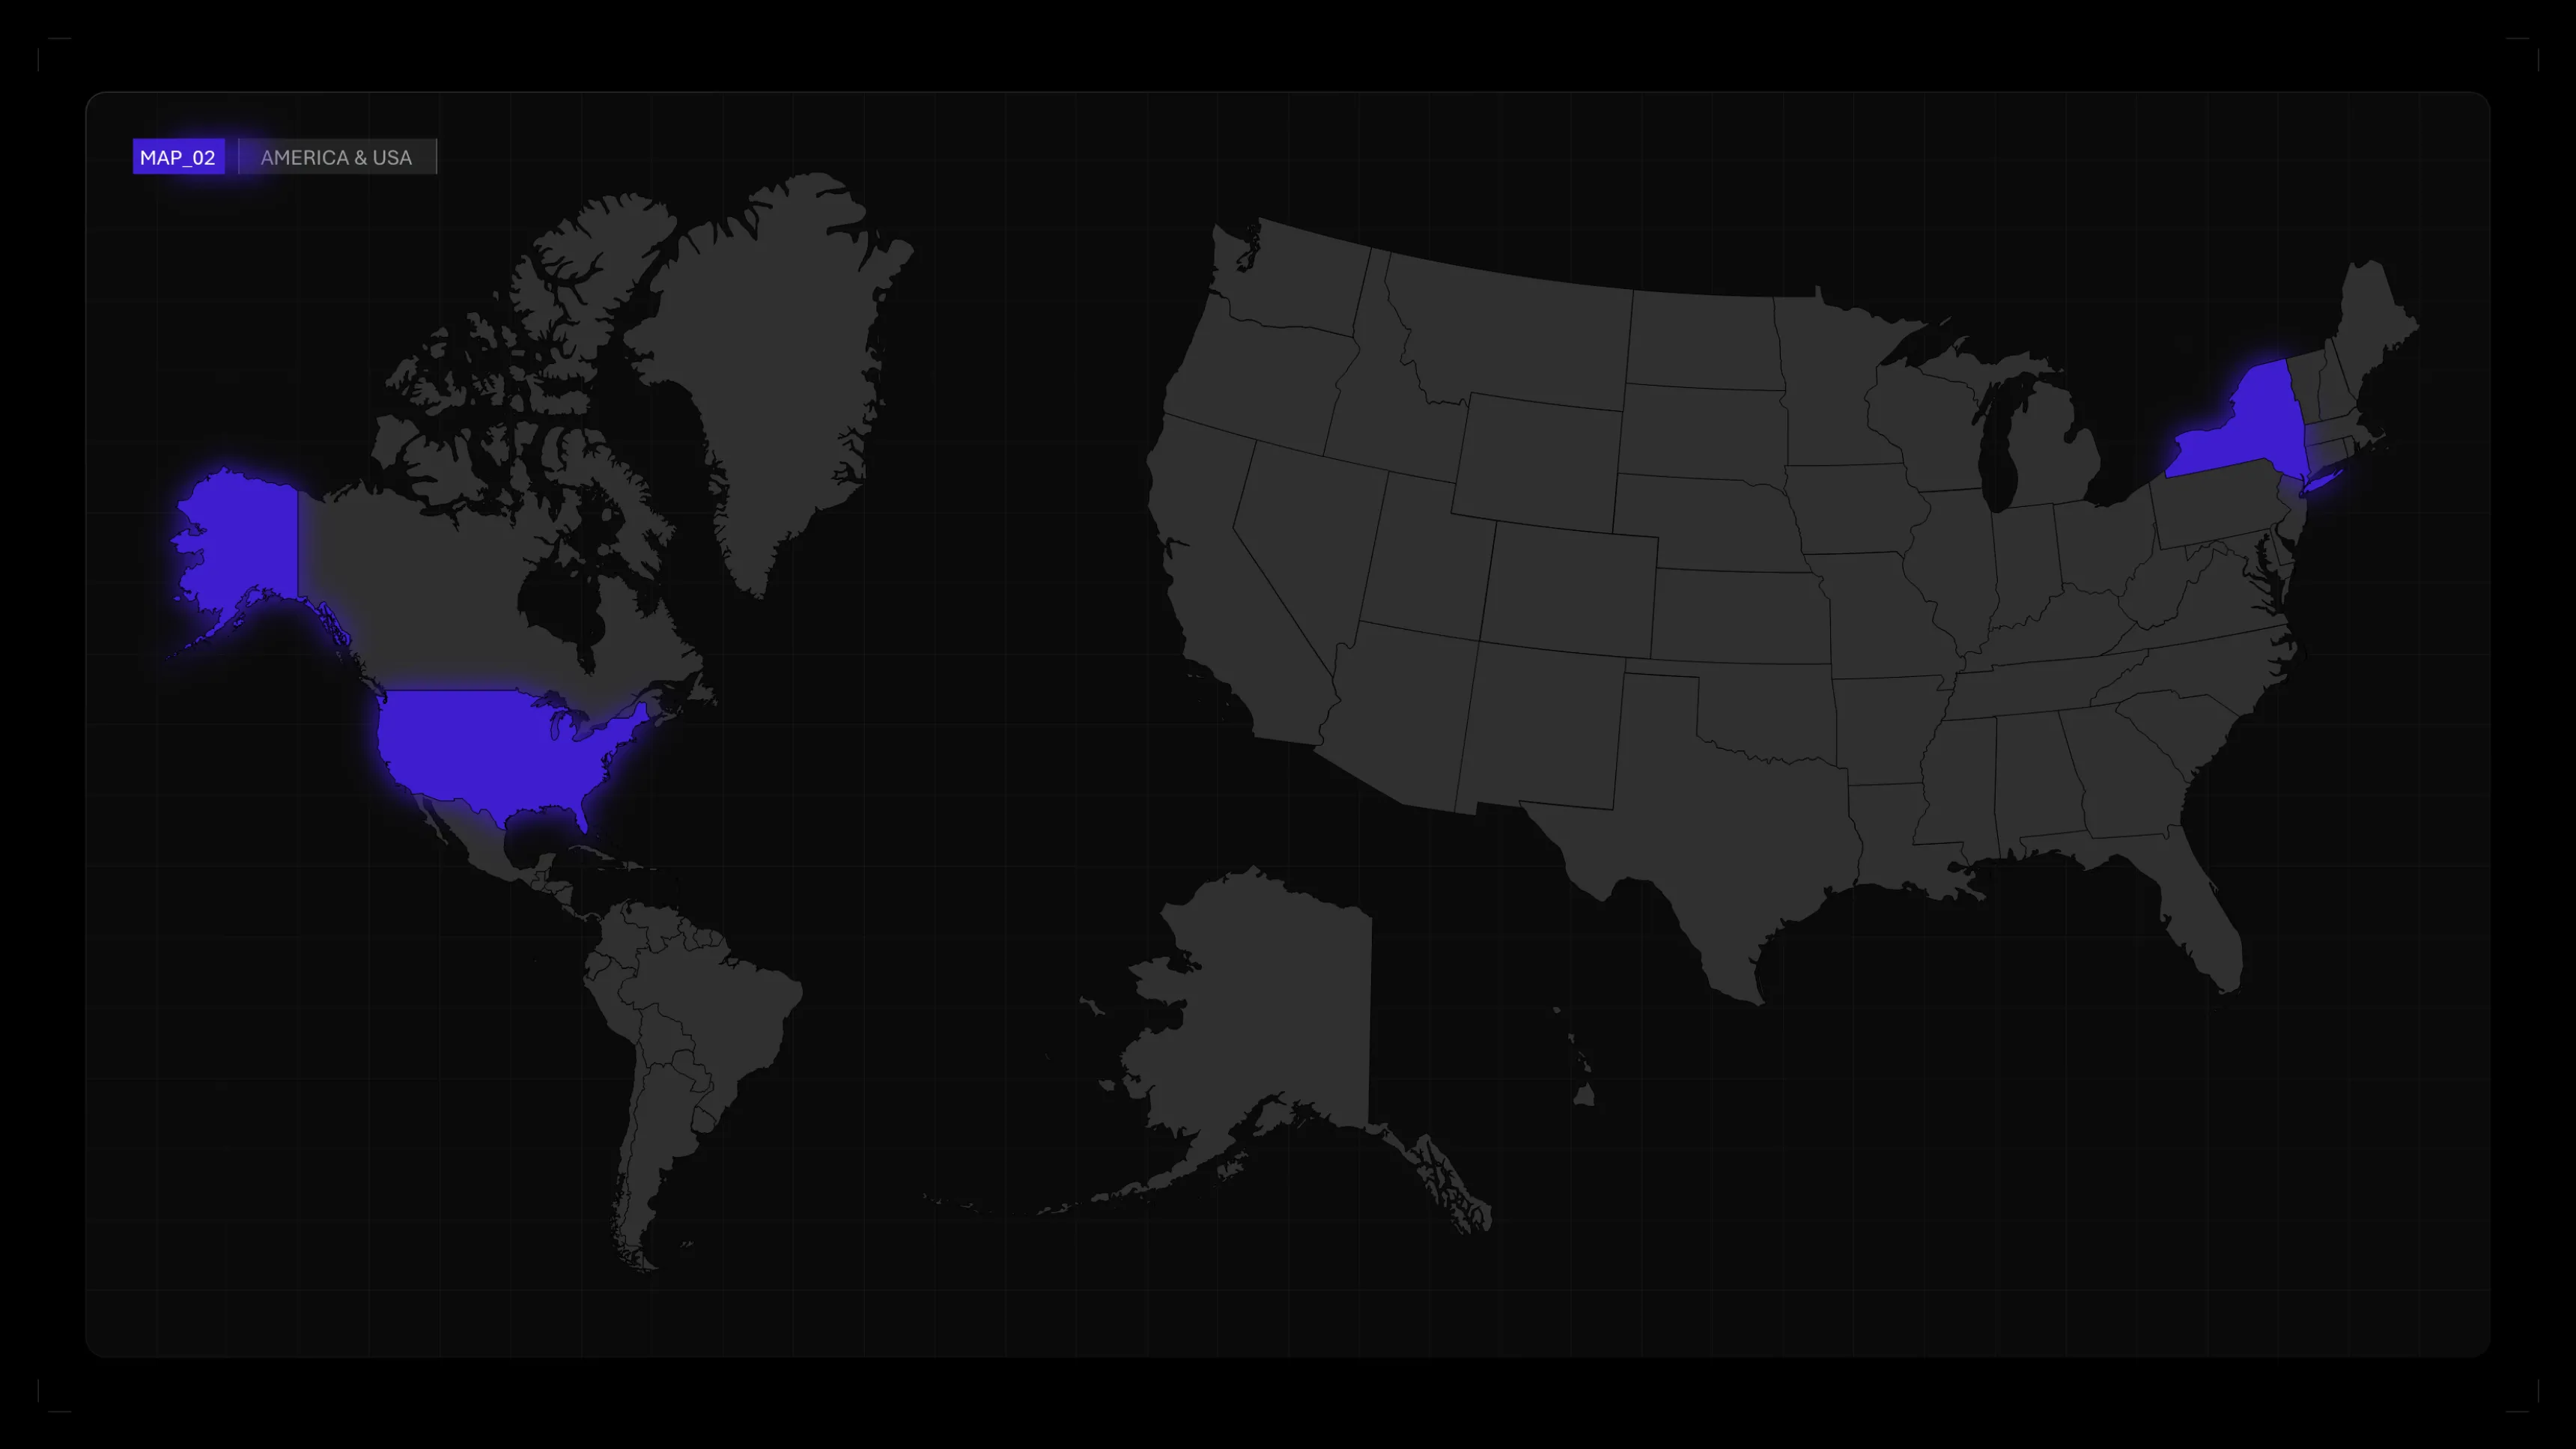
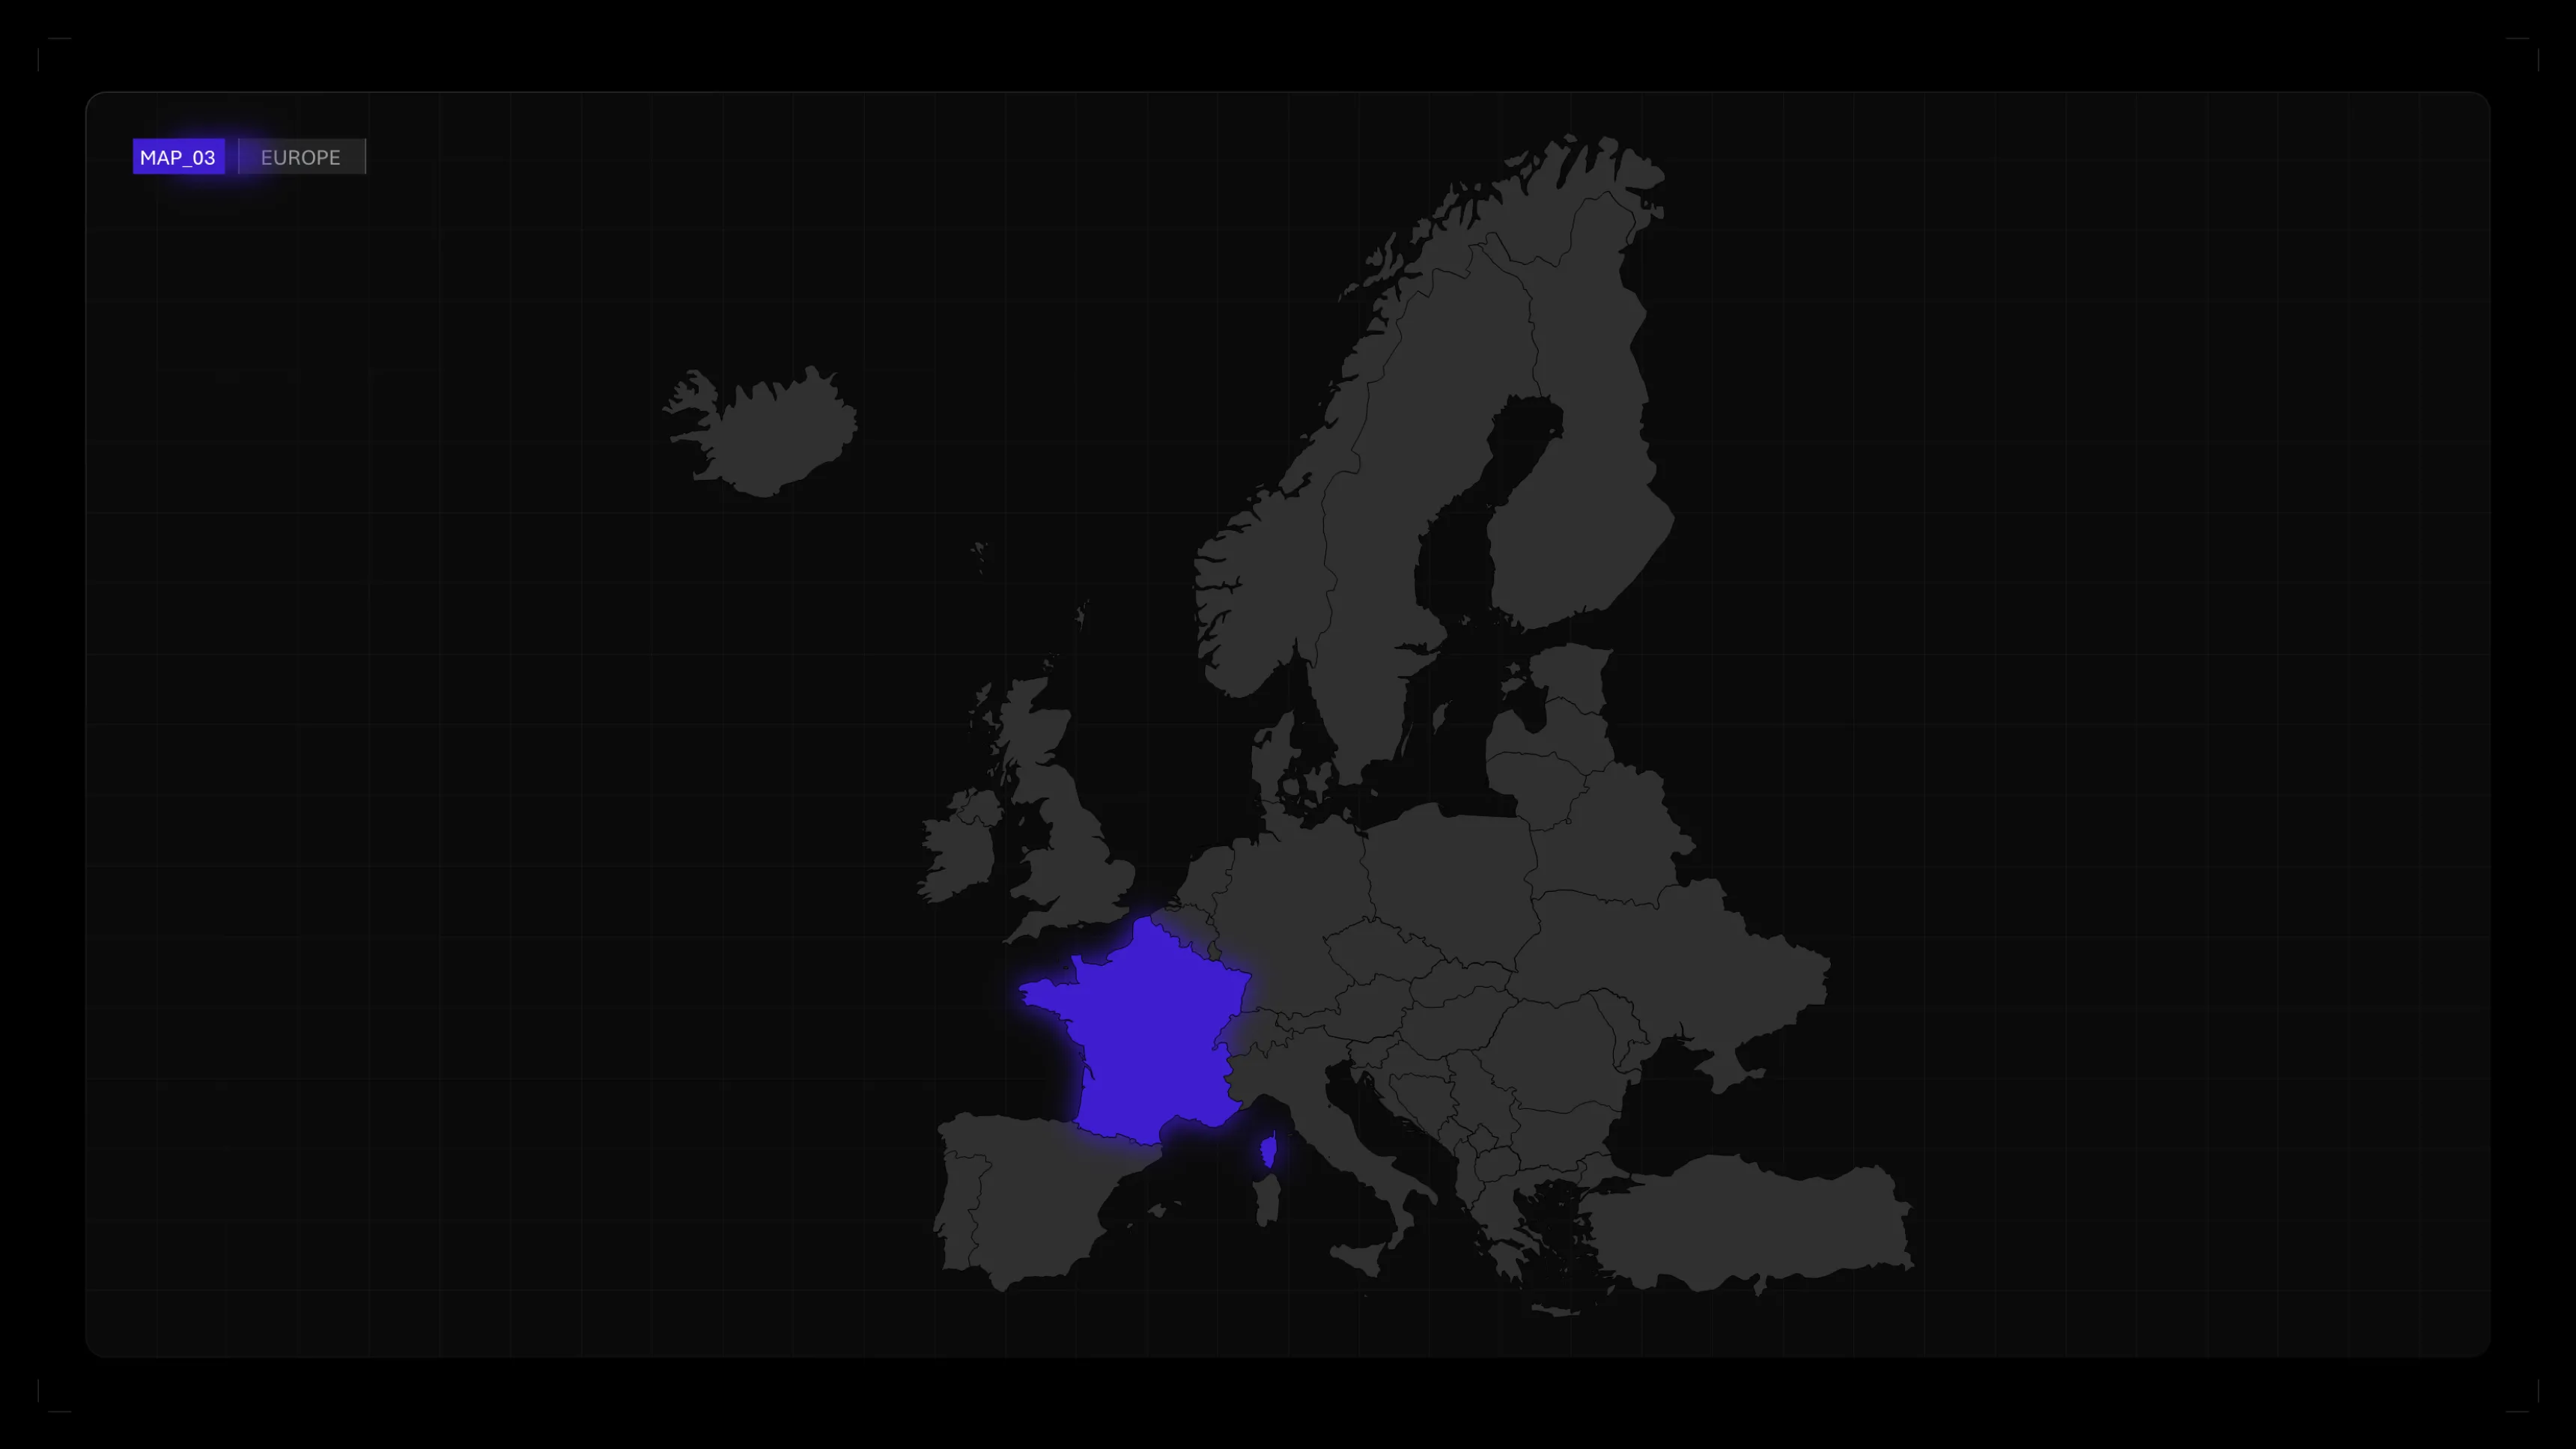
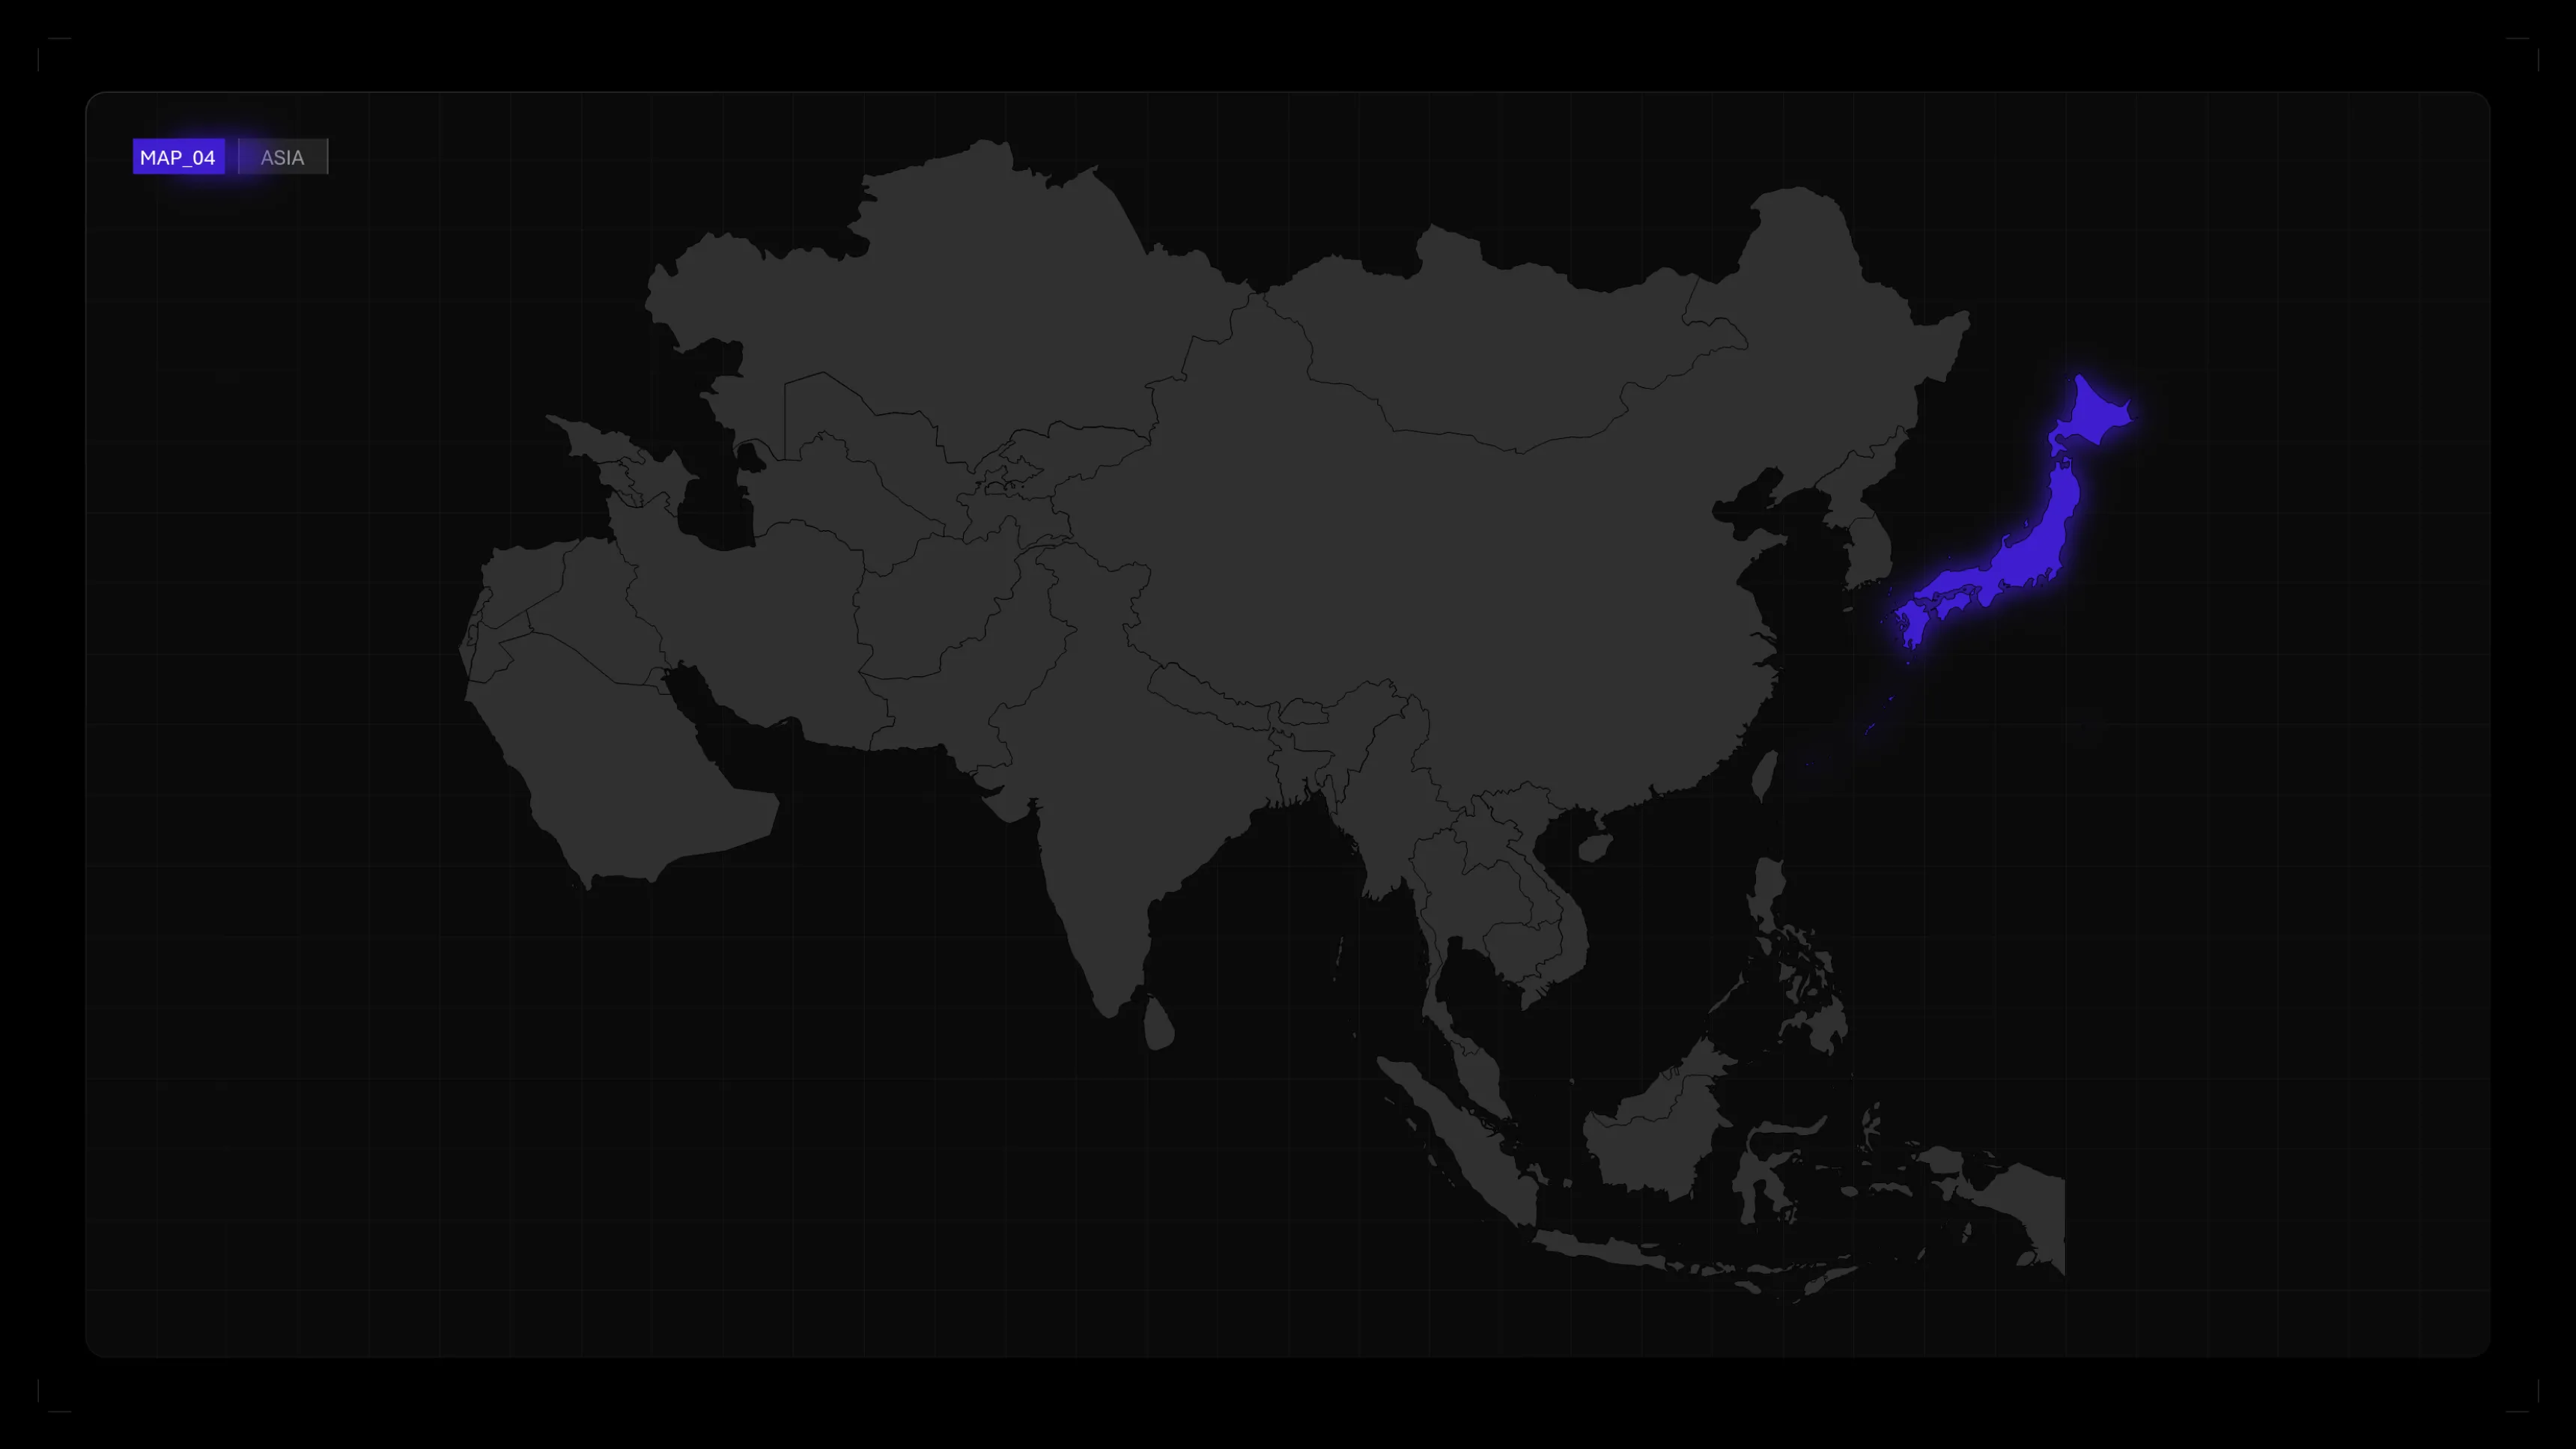
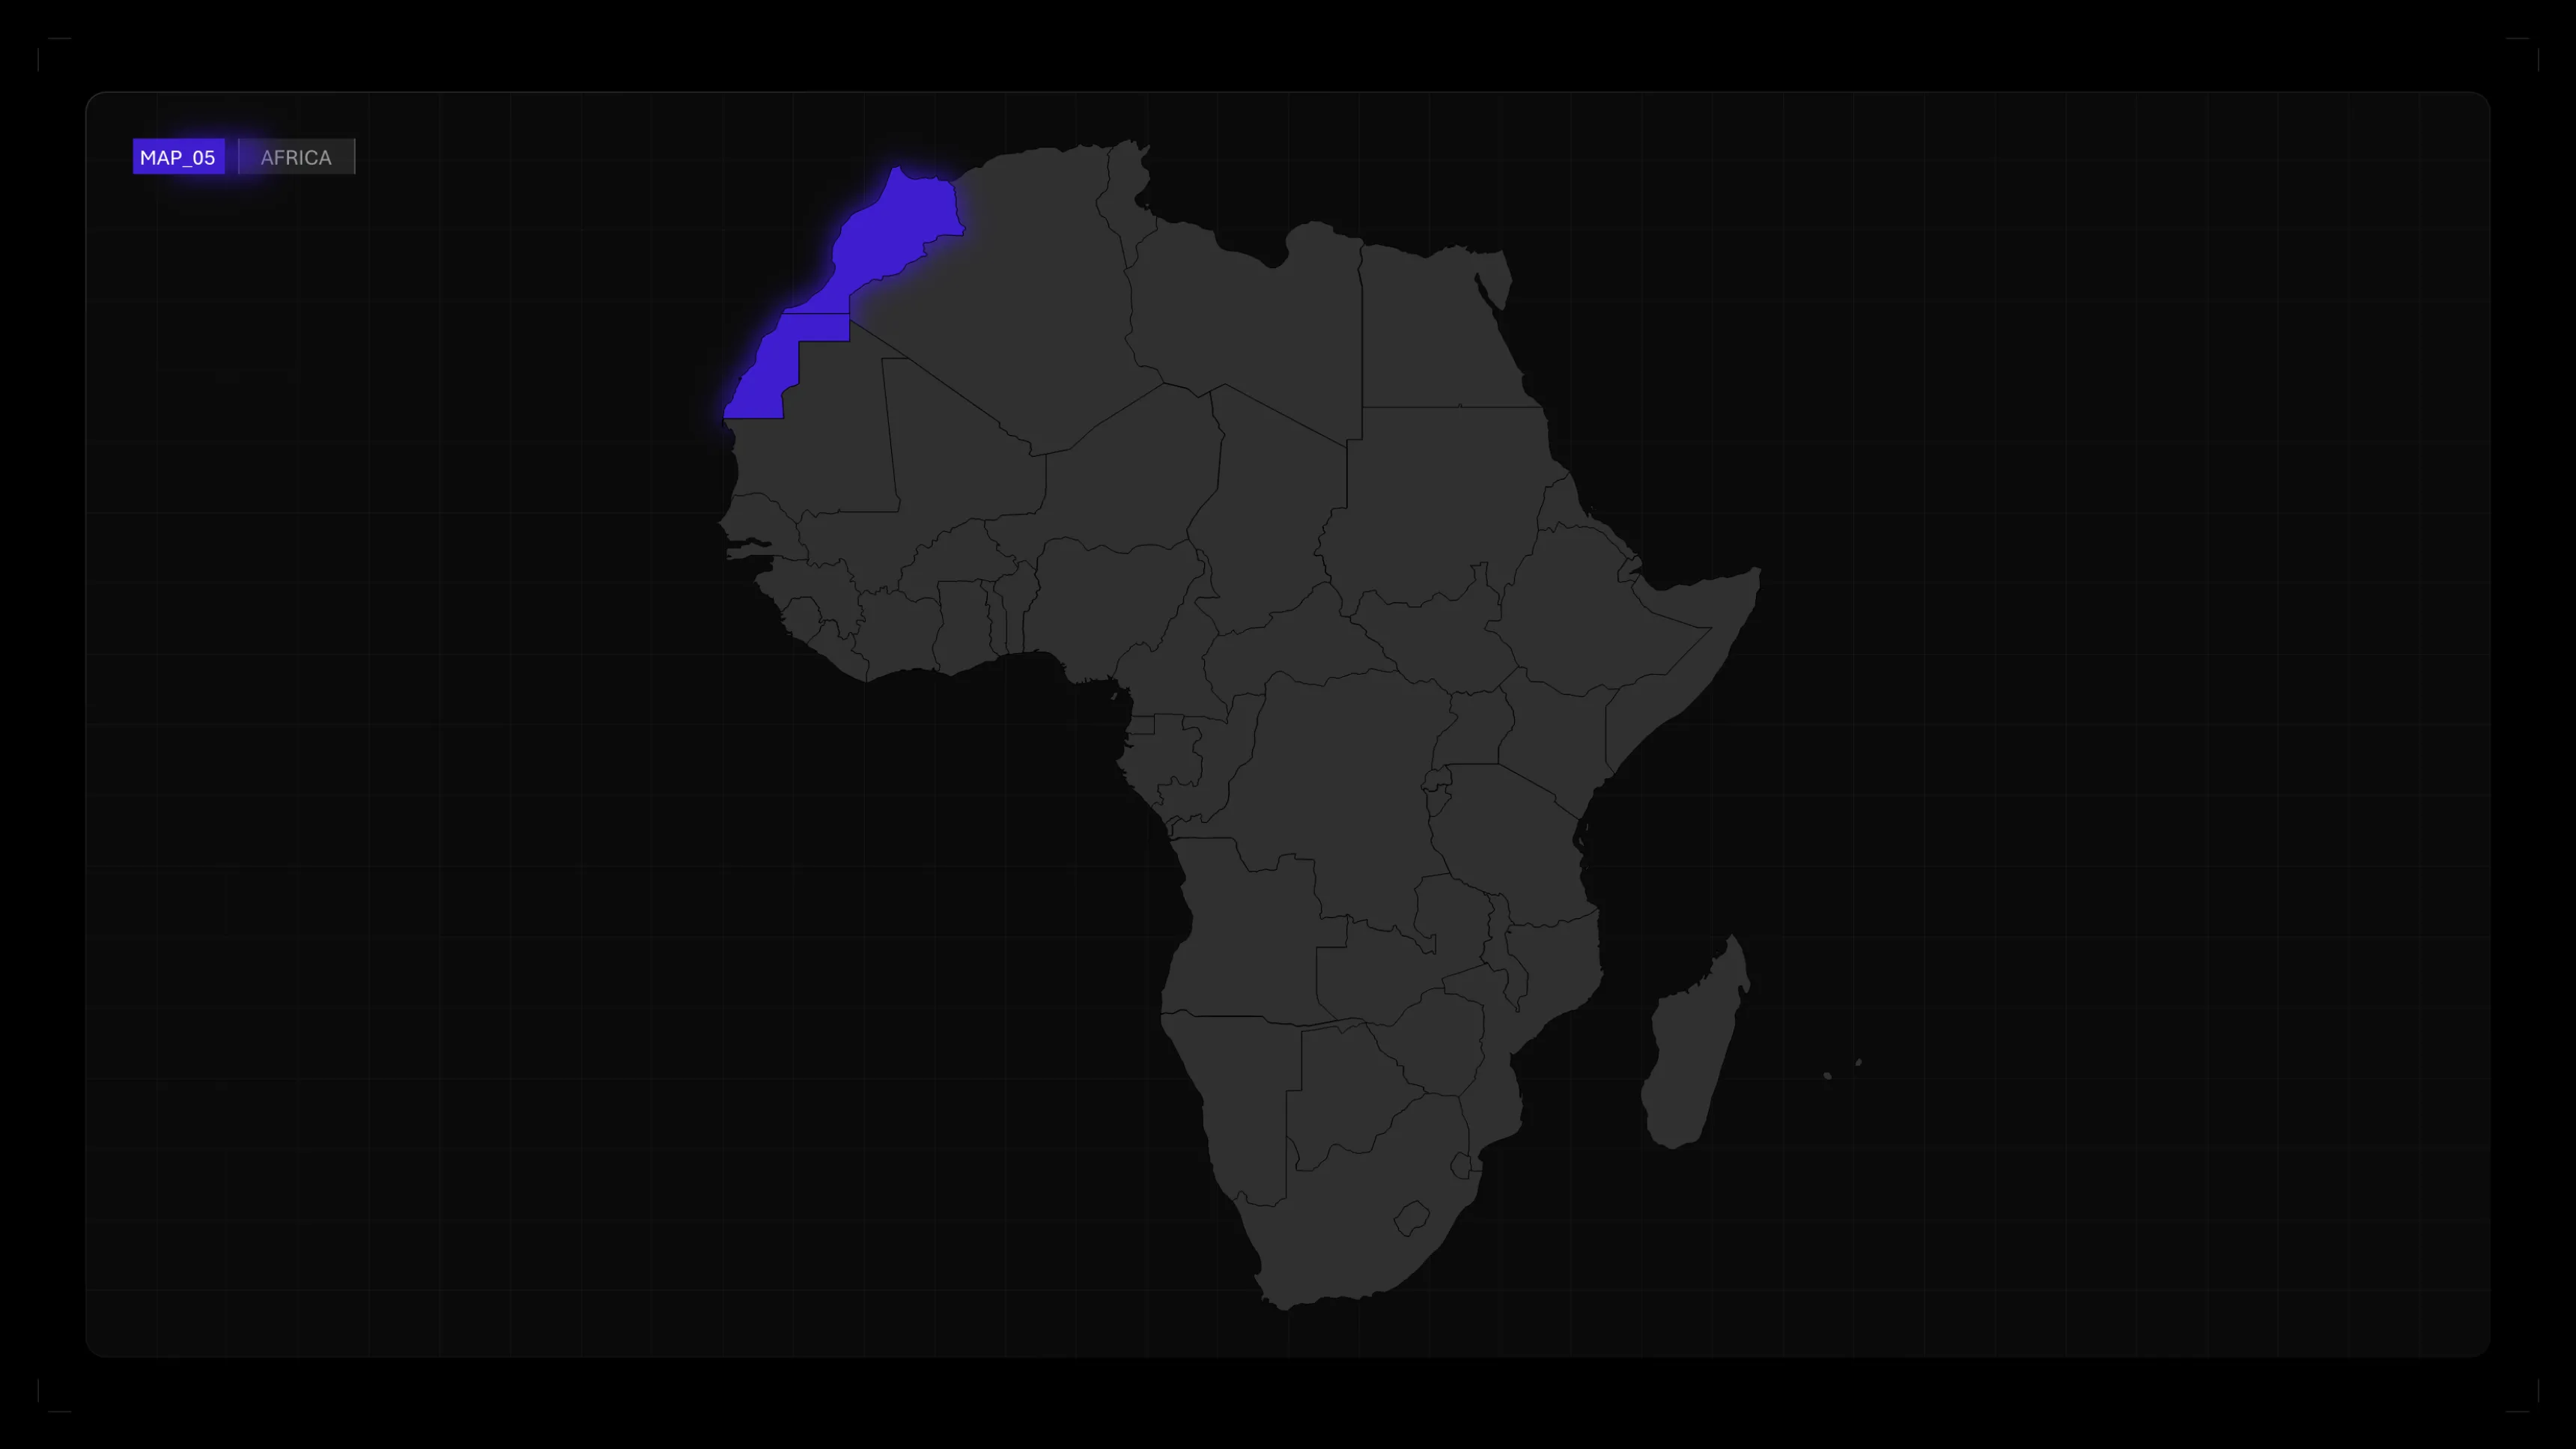
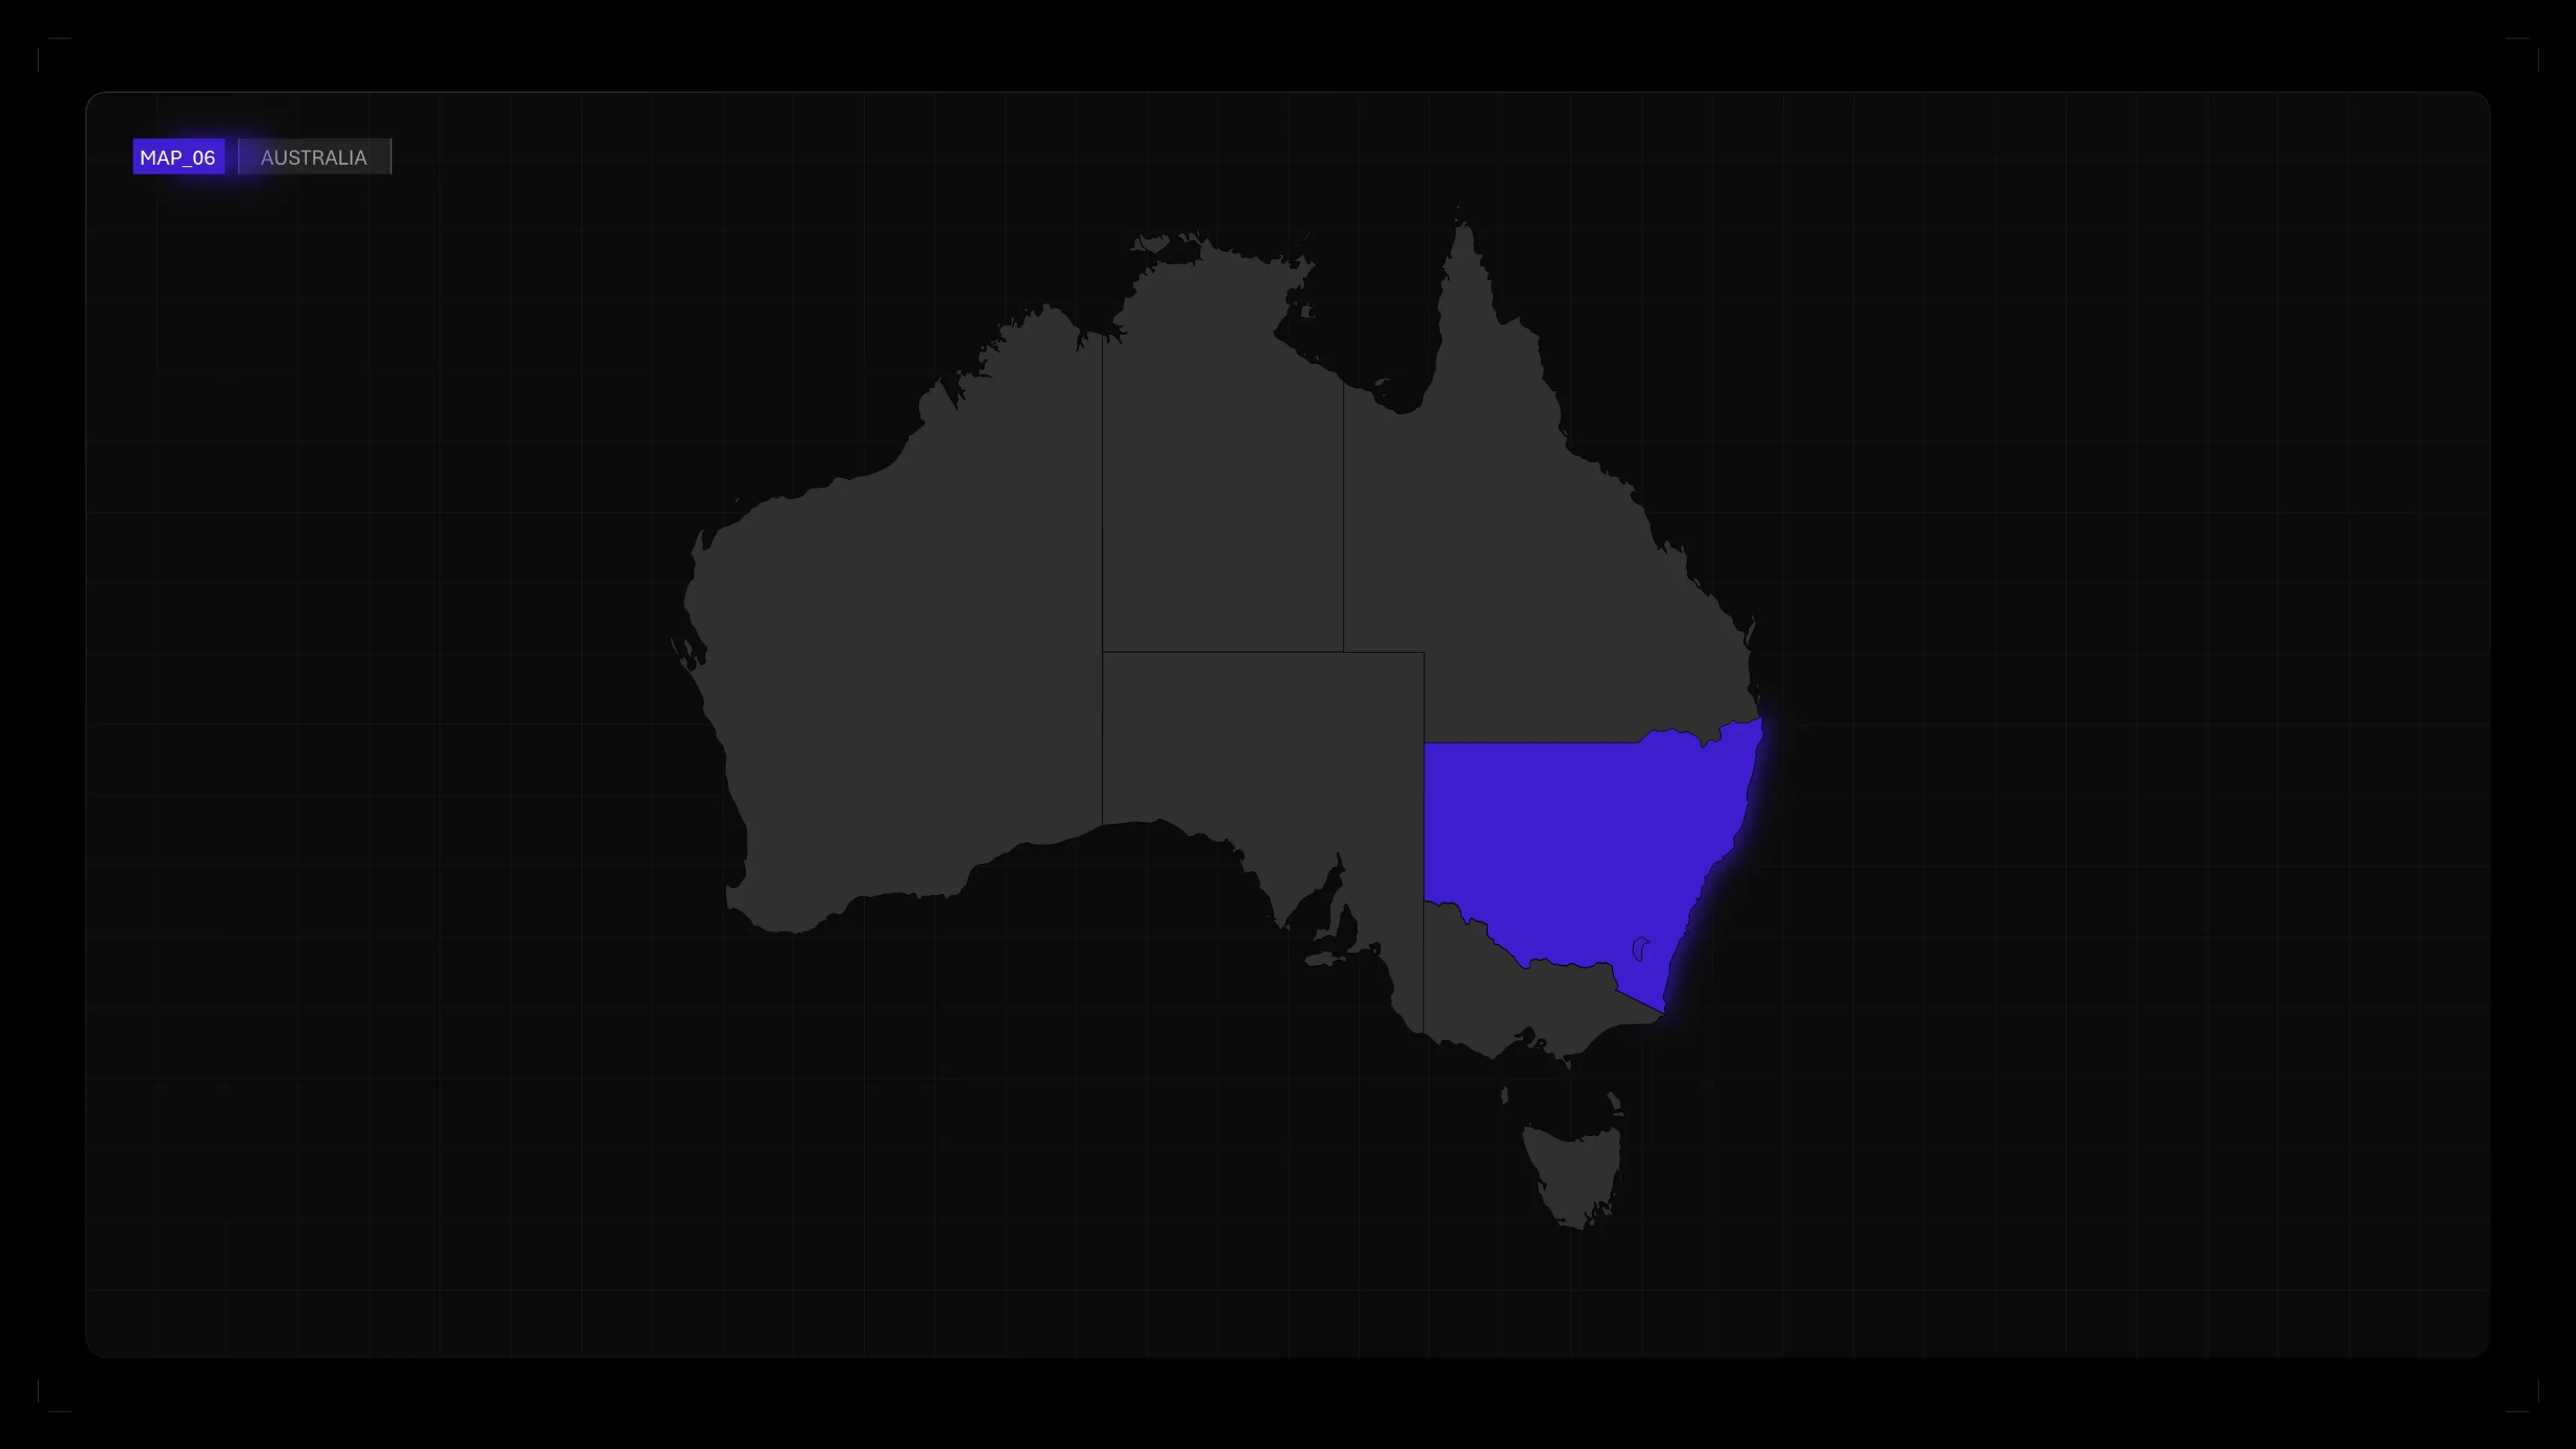
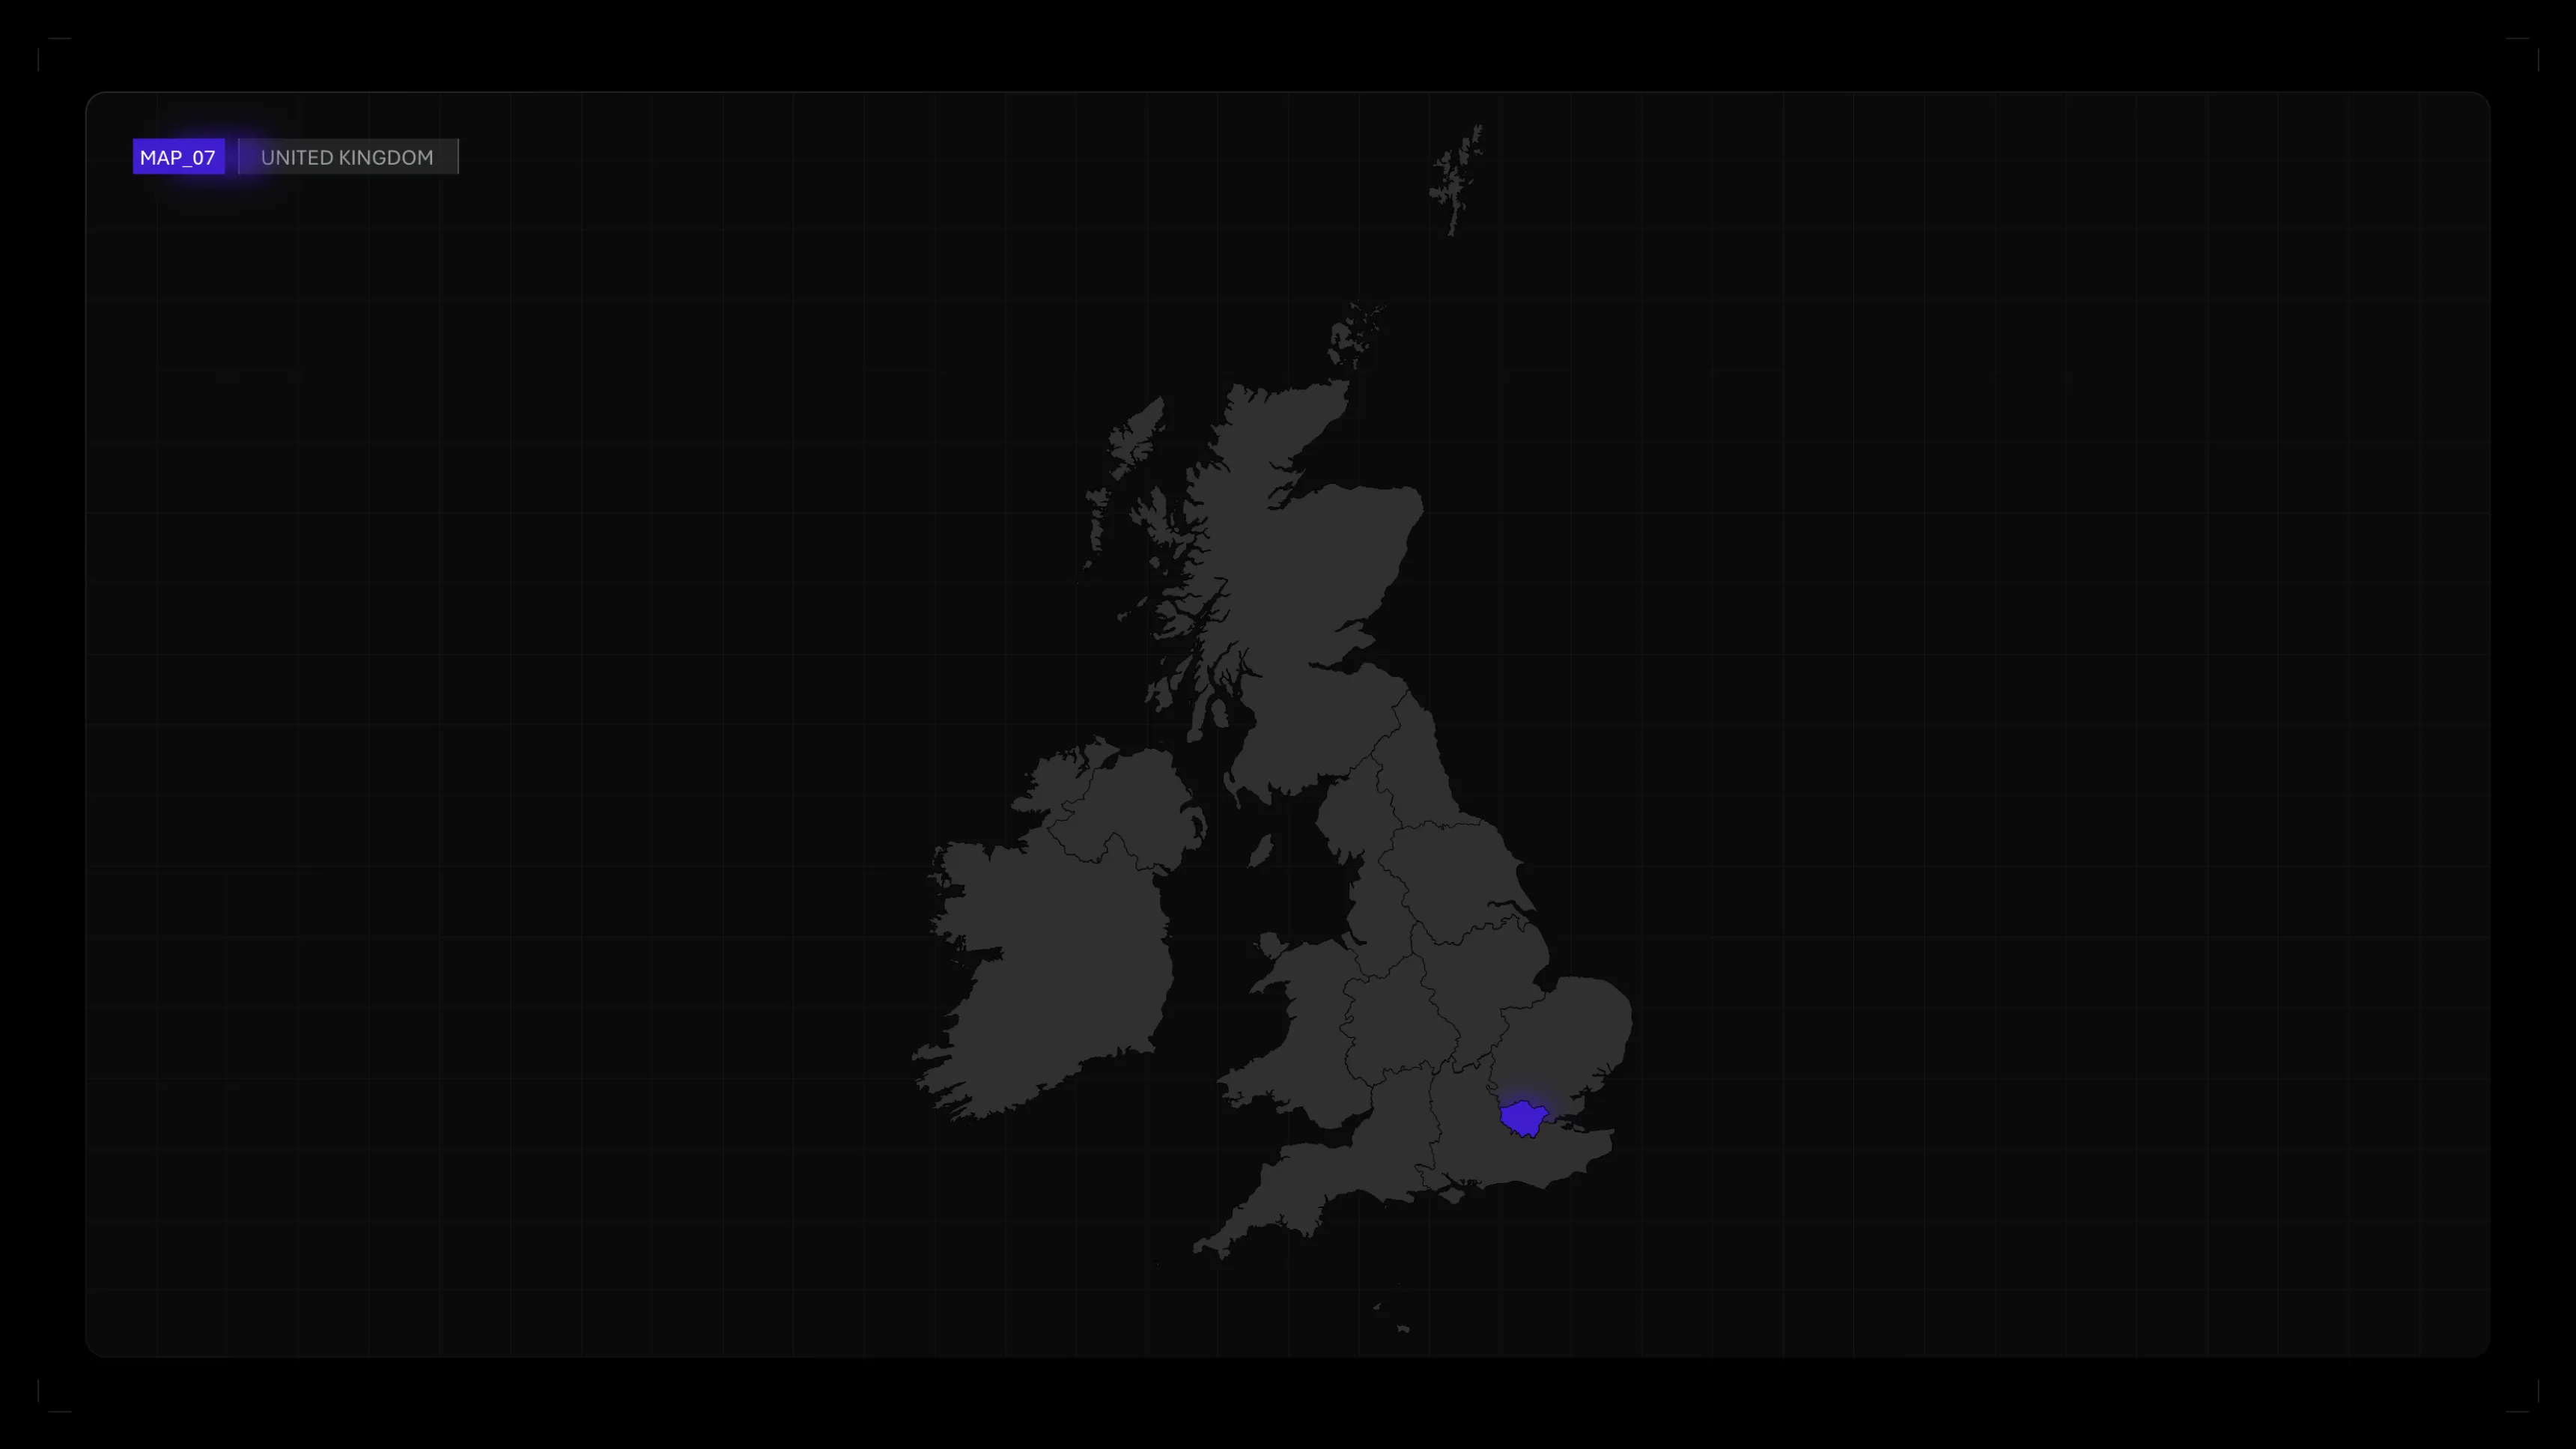
- Maps by continent: Europe, Africa, Asia, Asia, Americas, Oceania
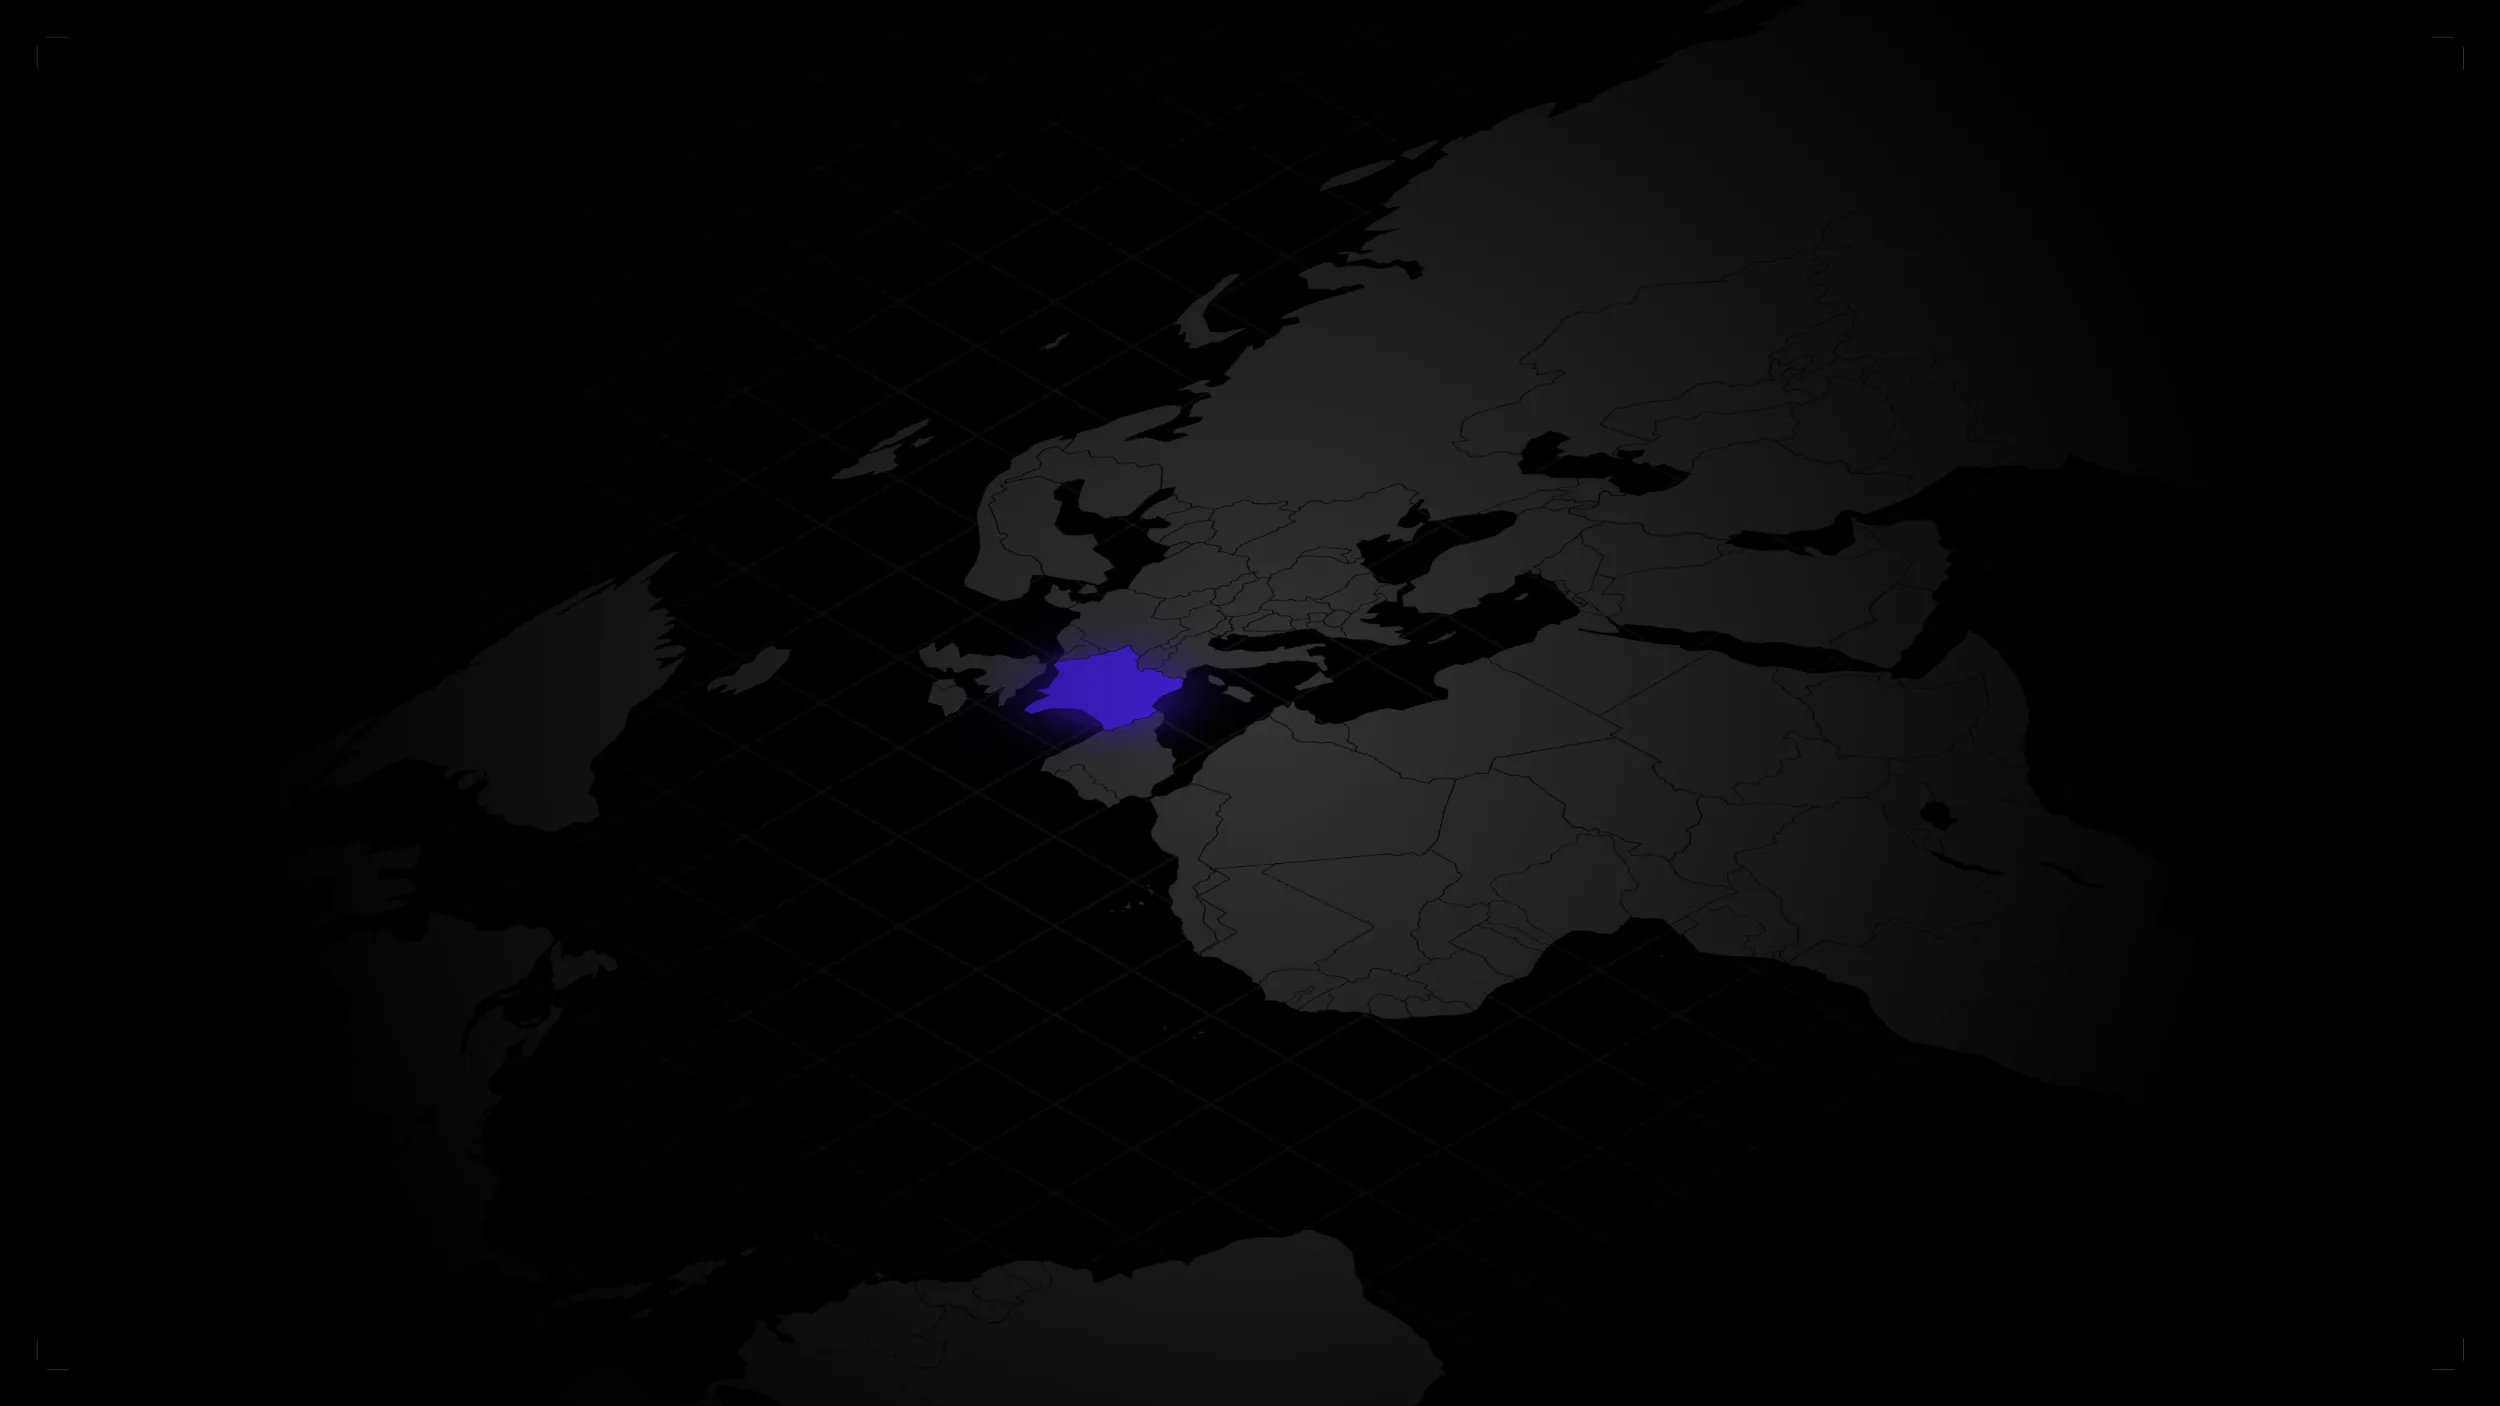
- Detailed map of France with regions
- Each country is an independent object: change the color, add data, highlight
- .pptx file compatible with all versions of PowerPoint
- Vector format - zoom and resize without losing quality
- 100% free
Why use our PowerPoint maps?
Each country on the map is an independent vector object. You can change the color of a country in one click to visualize your data: locations, market shares, coverage areas. Impossible with a simple image.
Quality files, offered by Slidor
These maps were designed by Slidor, PowerPoint agency. These are the same cards that we use in the presentations of our key account clients — made available free of charge.
No external software required
No need for Illustrator, Figma, or mapping software. Everything is done directly in PowerPoint: changing colors, adding legends, inserting data.
How do I change the color of a country?
1. Open the downloaded.pptx file
2. Click on the country you want to highlight
3. Go to Format > Shape Fill
4. Choose the color you want (or enter a hexadecimal code)
5. The country changes color instantly — the others remain the same
2. Click on the country you want to highlight
3. Go to Format > Shape Fill
4. Choose the color you want (or enter a hexadecimal code)
5. The country changes color instantly — the others remain the same
How do I change the color of the entire card?
Each file is grouped together, allowing you to select and change the color of all countries or just one.
How do I create a data card?
To transform the map into a data visualization:
- Assign one color per category (e.g. green = implanted, gray = not implanted)
- Use shades of the same color to represent intensities (e.g.: sales by country)
- Add a caption with PowerPoint text boxes
- Assign one color per category (e.g. green = implanted, gray = not implanted)
- Use shades of the same color to represent intensities (e.g.: sales by country)
- Add a caption with PowerPoint text boxes
Can I use these cards in a professional setting?
Yes, you can use this file freely for all your presentations.